ETH Сильно отскакивает, стратегия прорыва плотного скользящего среднего достигает 127% годового дохода|Исследование Gate
Предисловие
В этом двухнедельном квантовом отчете (с 25 апреля по 12 мая) анализируются рыночные тенденции биткойна и Эфириума, используя ключевые индикаторы, такие как соотношение длинных и коротких позиций, открытый интерес и процентные ставки. В отчете исследуется применение стратегии «Прорыв средней скользящей» на рынке ETH/USDT, подробно описывается ее логическая структура и механизм идентификации сигналов. Через систематическую оптимизацию параметров и обратное тестирование стратегия демонстрирует надежные показатели в распознавании тенденций и контроле рисков, с ясной дисциплиной исполнения. В целом, она превосходит простой подход к покупке и удержанию ETH, предлагая практическую основу для квантовой торговли.
Сводка
- За последние две недели как BTC, так и ETH выросли, причем ETH показал больший прирост и проявил большую волатильность.
- Долгосрочное соотношение длинных и коротких позиций ETH значительно колебалось, что указывает на сильную краткосрочную торговую активность и рыночную спекуляцию во время ралли, при этом короткие позиции не проявляли явного отступления.
- Открытый интерес к BTC увеличился медленнее, в то время как ETH испытал более сильный взлет в начале мая.
- В целом рынок деривативов пережил волну ликвидации коротких позиций в начале мая, за которой последовала ликвидация длинных позиций 12 мая, подчеркивающая усиливающееся расхождение рынка под высоким плечом.
- Для квантитативного анализа была использована стратегия "Dense Moving Average Breakout Strategy", которая при оптимальных параметрах показала доходность до 127%.
Обзор рынка
1. Анализ волатильности цен биткойна и эфира
С середины апреля как BTC, так и ETH показали стабильную восходящую тенденцию, поддерживая относительно синхронный темп до начала мая. За этот период BTC вырос с примерно 78 000 USDT до почти 105 000 USDT, в то время как ETH вырос с приблизительно 1 600 USDT до примерно 2 600 USDT. Увеличение ETH было заметно больше, чем у BTC, что демонстрирует большую ценовую эластичность. В начале мая оба актива испытали резкий скачок, вероятно, вызванный смягчением тарифной политики, и BTC вошел в фазу отдачи.
BTC, с более высокой ценой и более низкой волатильностью, продемонстрировал более стабильную траекторию; в то время как ETH показал более сильный и быстрый рост. Изначально на рынке отсутствовали бычьи ожидания по отношению к ETH, что заставило его отстать. Однако по мере приближения мая — с предстоящим обновлением Pectra и снятием тарифов — ETH привлек внимание и пережил всплеск торгового объема, догоняя в производительности. Это расхождение указывает на обновленное краткосрочное внимание к ценности аллокации ETH на рынке.
Рисунок 1: BTC поднялся почти до 105 000 USDT, в то время как ETH стремился к отметке в 2 600 USDT — показывая более агрессивный рост и быструю реакцию цены.
С точки зрения волатильности как BTC, так и ETH испытали значительные изменения в паттернах колебаний с начала апреля по середину мая. В середине апреля волатильность BTC часто возрастала, отражая повышенное рыночное настроение и резкие корректировки цен. Однако к концу апреля и началу мая волатильность начала снижаться, что указывает на краткий период стабилизации рынка.
В отличие от этого, волатильность ETH испытала несколько резких взлетов, особенно вокруг прорыва цены, иногда даже превышая BTC. Это указывает на то, что ETH испытала более интенсивные краткосрочные колебания во время своего восходящего движения. В целом волатильность BTC была более равномерно распределена, в то время как волатильность ETH сосредоточилась в нескольких критических моментах, особенно вокруг ключевых прорывов цен, что свидетельствует о том, что ETH более подвержен моментальным капиталовложениям.
Рисунок 2: BTC проявлял относительно стабильную волатильность, в то время как ETH испытывал несколько резких всплесков волатильности.
В целом ETH продемонстрировал более крупный прирост цен и более концентрированные скачки волатильности во время этого рыночного цикла, что указывает на более сильную ценовую реакцию в ключевые моменты. В отличие от этого, BTC показал более стабильную восходящую тенденцию с более равномерно распределенным профилем волатильности, отражая его относительную устойчивость в условиях рыночных флуктуаций.
Хотя оба актива испытали синхронный взлет цен, их паттерны волатильности и ритмы разошлись значительно, подчеркивая отличительные рыночные характеристики и структурную динамику.
С точки зрения краткосрочной торговли контроль за притоками капитала в BTC и изменениями волатильности может служить ключевым индикатором общего аппетита к риску на рынке.
2. Анализ коэффициента длинной краткой позиции (LSR) для биткоина и эфира
Длинно-короткое соотношение (LSR) - ключевой показатель для измерения относительного объема агрессивных длинных и коротких позиций на рынке. Обычно используется для оценки рыночного настроения и силы доминирующих тенденций. LSR больше 1 указывает на то, что агрессивные ордера на покупку (длинные) превышают агрессивные ордера на продажу (короткие), что свидетельствует о бычьем настроении рынка.
По данным Coinglass, как BTC, так и ETH показали четкую восходящую тенденцию цен за последние две недели. Однако их LSR-шаблоны показывают различную степень расхождения. Для BTC LSR показал небольшой рост на ранней стадии ралли, но оставался колеблющимся вокруг 1, даже опускаясь ниже 1 примерно 10 мая. Это говорит о том, что несмотря на рост цен, короткие позиции также увеличились, что подразумевает, что некоторые инвесторы решили застраховаться или открыть короткие позиции на более высоких уровнях. На рынке не сформировалась четкая односторонняя бычья структура, и остается некоторое сомнение в устойчивости ралли.
В отличие от этого, LSR ETH проявил больше волатильности. Во время резкого роста с $2,000 до $2,600 коэффициент не поднимался стабильно, а вместо этого испытывал несколько резких колебаний, включая заметное падение около 10 мая. Это свидетельствует о том, что взлет цены ETH сопровождался интенсивной краткосрочной торговлей и рыночной борьбой, сохранившимся короткими позициями. Рыночное настроение оставалось разделенным на протяжении всего ралли.
Хотя BTC и ETH оба показали значительный рост цен за последние две недели, их LSR не показал устойчивого увеличения. Напротив, данные отражают широкую осторожность и хеджирование на более высоких уровнях цен, что свидетельствует о том, что бычий импульс не имеет четкой структурной поддержки, и инвестиционный сентимент остается осторожным.
Рисунок 3: Снижение BTC LSR в условиях волатильности, указывающее на ослабление бычьего импульса на более высоких уровнях
Рисунок 4: ETH LSR показывает высокую волатильность, отражающую значительное расхождение рыночного настроения
3. Анализ открытого интереса
Согласно данным от Coinglass, открытый интерес как у BTC, так и у ETH показал общий восходящий тренд, что указывает на рост участия рынка и торговой активности. Открытый интерес BTC стабильно рос с уровня около $60 миллиардов, испытывая некоторые флуктуации, но в основном удерживаясь на повышенных уровнях, в конечном итоге стабилизировавшись в начале мая. Открытый интерес ETH вырос с приблизительно $18 миллиардов до почти $24 миллиардов, следуя аналогичной траектории BTC, но с более стабильным движением. Следует отметить, что ETH заметно увеличил открытый интерес в начале мая, сигнализируя о возобновлении притока капитала и активном позиционировании во время этого периода.[4]
В целом одновременный рост открытого интереса и цен на оба актива подтверждает увеличение участия рынка и большее использование плеча. Однако, в то время как притоки BTC выровнялись после конца апреля, ETH продемонстрировал более сильный восходящий импульс в начале мая, что говорит о всплеске интереса к деривативной торговле ETH в краткосрочной перспективе.
Фигура 5: открытый интерес к BTC показывает более медленный восходящий импульс, в то время как ETH видит более сильный взлет в начале мая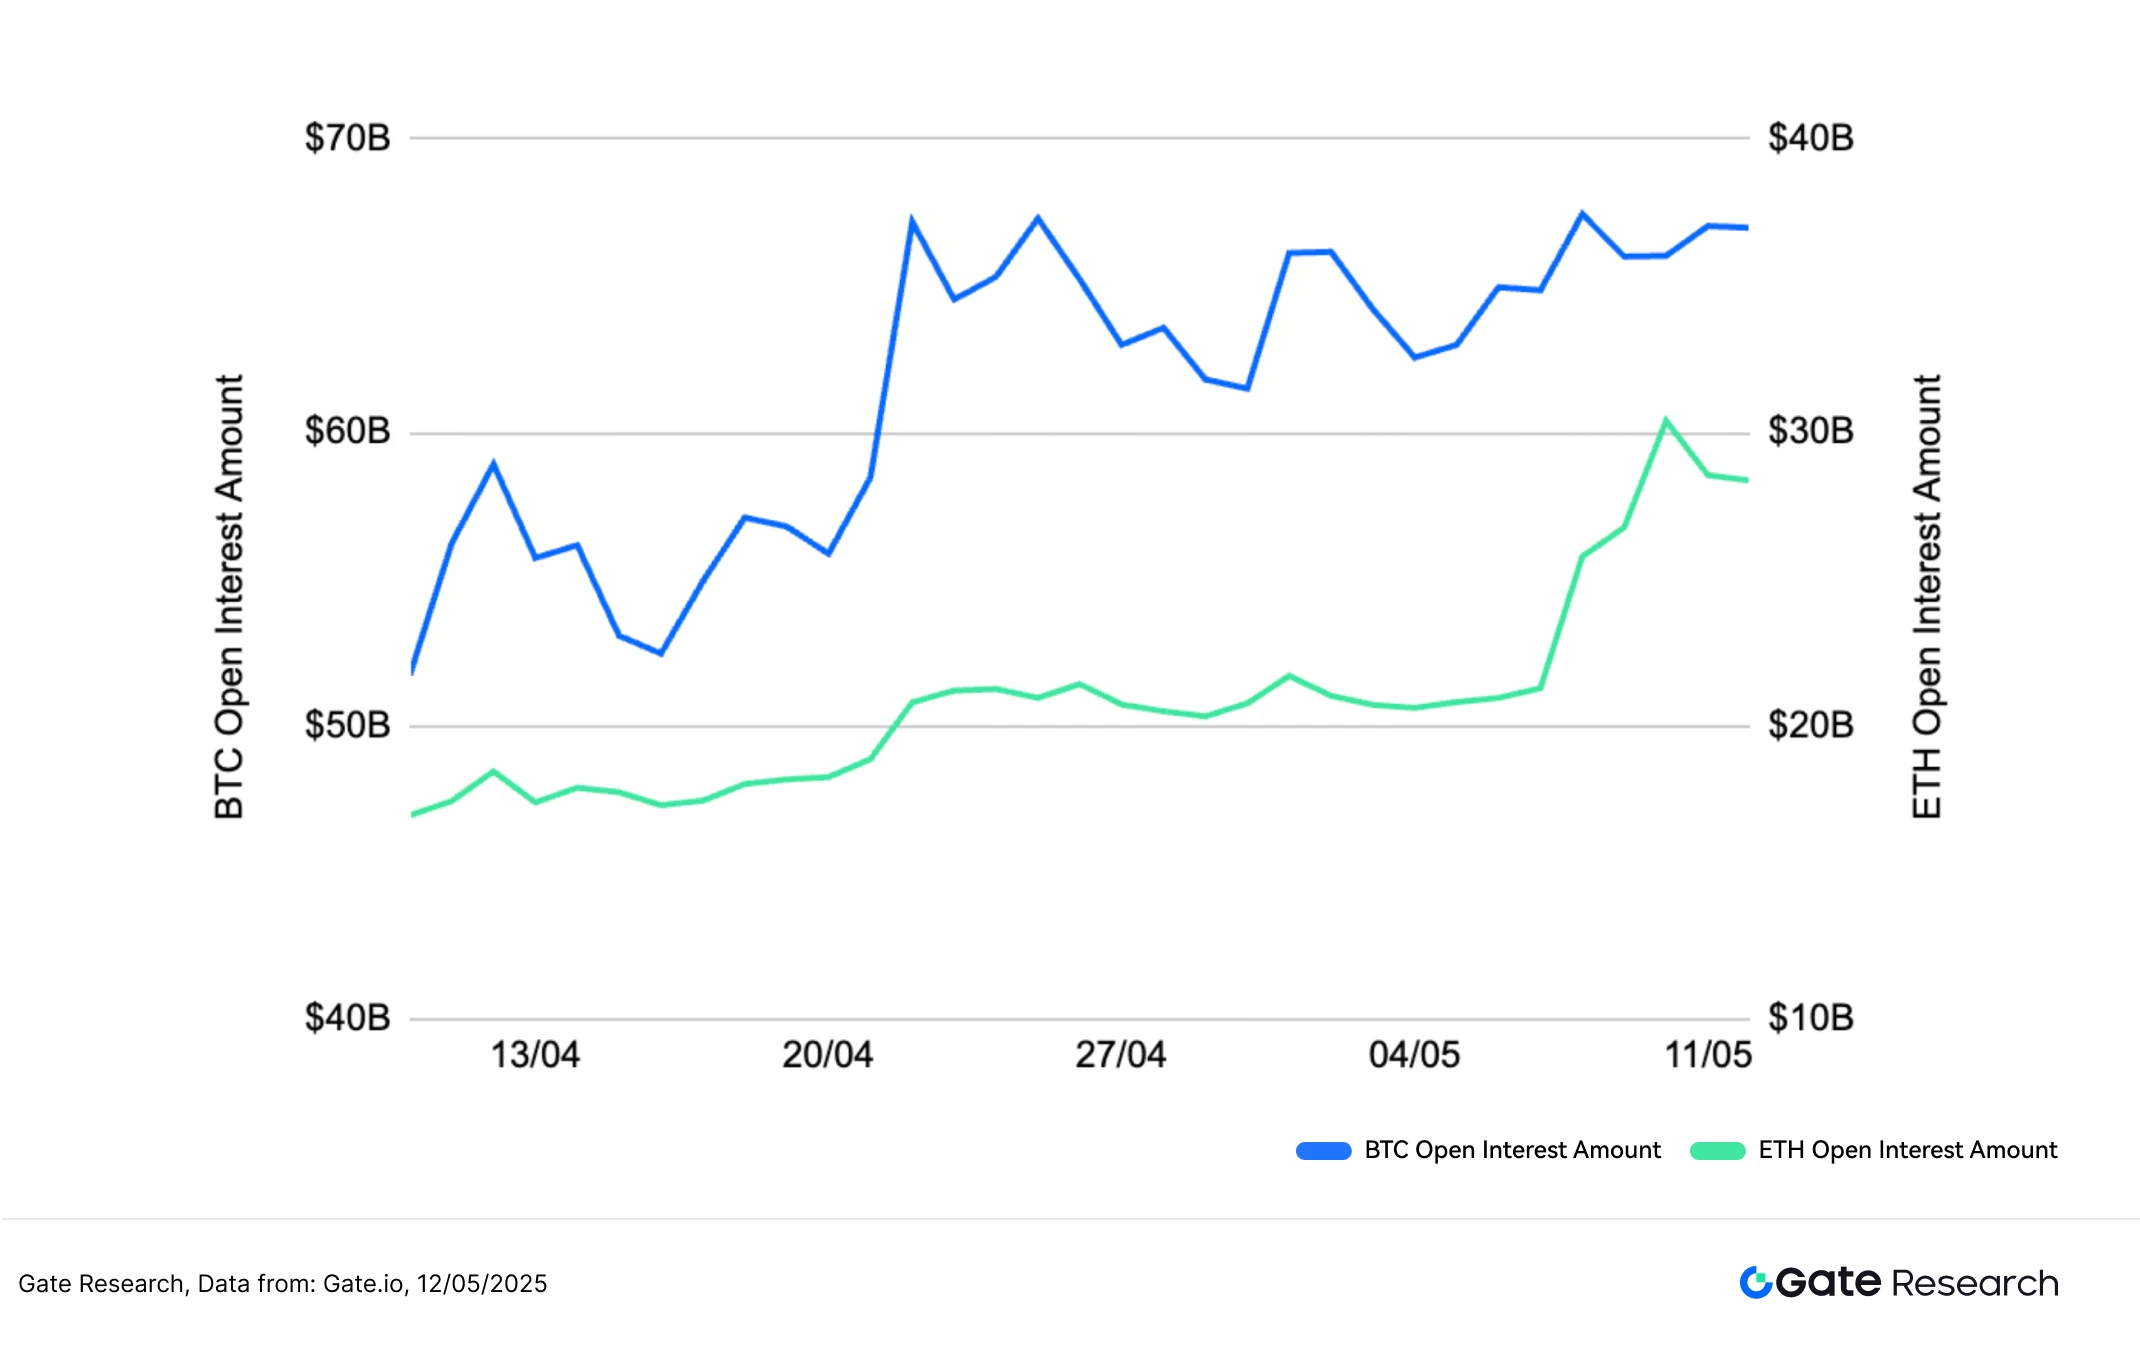
4. Ставка финансирования
Ставки финансирования для BTC и ETH в целом незначительно колебались вокруг 0%, часто переключаясь между положительными и отрицательными, что указывает на относительно сбалансированную борьбу между длинными и короткими позициями. В конце апреля BTC несколько раз испытал отрицательные ставки финансирования, с заметным падением до -0,025% около 20 апреля, что может свидетельствовать о доминировании коротких позиций в то время - возможно из-за крупномасштабной хеджирования. ETH показало схожий паттерн в это время, хотя с немного меньшими колебаниями, указывающими на временный сдвиг к медвежьему настроению без устойчивого давления.
По мере роста цен и увеличения открытого интереса ставки по финансированию как для BTC, так и для ETH постепенно стали положительными, стабилизируясь между 0% и 0.01%. Это отражает растущий бычий настрой и активное долгосрочное позиционирование. Однако тот факт, что ставки по финансированию не резко увеличились, свидетельствует о том, что хотя плечо на длинных позициях увеличилось, рынок не перегрет, и настроение остается осторожно оптимистичным.
Рисунок 6: Ставки финансирования BTC и ETH постепенно становятся положительными и остаются в пределах от 0% до 0.01%, отражая растущую бычью тенденцию и активную длинную позицию
5. График ликвидации криптовалюты
Согласно данным Coinglass, с середины апреля криптовалютный рынок переживал чередующиеся волны ликвидации длинных и коротких позиций, при этом короткая ликвидация особенно активизировалась в начале мая. 8 мая короткая ликвидация значительно выросла, достигнув 836 миллионов долларов за один день, что указывает на резкий рост цен, вынуждая ликвидировать многие короткие позиции.
12 мая, по мере увеличения волатильности рынка, заметно выросли распродажи длинных позиций, с общим дневным объемом в $476 млн, что свидетельствует о том, что некоторые трейдеры, вошедшие в длинные позиции на более высоких уровнях, не смогли выдержать откат и были принудительно ликвидированы. Это указывает на то, что несмотря на общий бычий тренд, краткосрочная волатильность остается высокой, и как длинные, так и короткие позиции страдают на ключевых точках перегиба. Деривативный рынок остается очень активным и сосредоточенным на риске.
Этот шаблон соответствует ранее сделанным наблюдениям о росте цен, увеличении открытого интереса и изменении ставок финансирования на положительные, что подчеркивает, как шорты были вымыты во время крупных прорывов цен, давая быкам временное преимущество. Однако даже во восходящем тренде длинные позиции все равно могут столкнуться с ликвидацией на местных максимумах, особенно во время периодов усиленной волатильности, таких как середина мая. Это подчеркивает устойчивую волатильность на рынке, где высокий уровень кредитного плеча и активное риск-хеджирование остаются определяющими чертами торговли криптодеривативами.
Рисунок 7: Краткосрочные ликвидации взлетели 8 мая, достигнув $836 миллионов за один день
Количественный анализ – стратегия прорыва плотного скользящего среднего
(Предупреждение: Все прогнозы в этой статье основаны на исторических данных и рыночных тенденциях и предназначены исключительно в информационных целях. Их нельзя считать инвестиционными советами или гарантией будущей рыночной производительности. Инвесторам следует тщательно оценить риски и принимать благоразумные решения при осуществлении связанных инвестиций.)
1. Обзор стратегии
Стратегия "Плотное прорывное среднее движение" - это подход на основе импульса, который включает в себя технический анализ тренда. Стратегия идентифицирует потенциальные направленные рыночные движения, наблюдая за сближением нескольких коротких и средних скользящих средних (например, 5-дневных, 10-дневных, 20-дневных) за определенный период. Когда эти скользящие средние начинают выравниваться и кластеризоваться близко, это typично сигнализирует о фазе консолидации, указывая на то, что рынок готовится к прорыву.
Если цена решительно преодолевает кластерные скользящие средние, это интерпретируется как сигнал бычьего прорыва. Напротив, прорыв ниже полосы скользящей средней указывает на медвежий сигнал.
Для повышения практичности и улучшения управления рисками стратегия также включает механизмы фиксированного процентного уровня прибыли и стоп-лосс, позволяющие своевременно входить и выходить при появлении тенденций, балансируя вознаграждение и риск. В целом эта стратегия разработана для захвата возможностей коротких и среднесрочных тенденций, предлагая дисциплинированную и действенную торговую схему.
2. Настройки основных параметров

3. Логика стратегии и операционный механизм
Условия входа
Проверка схождения скользящих средних: Рассчитайте расстояние между максимальными и минимальными значениями шести скользящих средних — SMA20, SMA60, SMA120, EMA20, EMA60 и EMA120. Когда расстояние опускается ниже заданного порога (например, 1.5% от цены), это считается схождением скользящих средних.
«Порог» относится к критическому значению, при котором происходит срабатывание эффекта, либо как минимум, либо как максимум.Условия разрыва цены:
- Если текущая цена прорывается выше самой высокой из шести скользящих средних, это считается сигналом восходящего прорыва и запускает купитьоперация.
- Если текущая ценападает ниже самого низкого из шести скользящих средних, это считается сигналом разворота вниз и вызывает продатьоперация.
Условия выхода: динамический механизм фиксации прибыли и остановки убытков
Выход из длинной позиции:
- Если цена падает ниже самой низкой скользящей среднейв момент входа, стоп-лосс is triggered.
- Если цена рост на сумму, превышающую расстояние между ценой входа и самым низким MA × коэффициентом риска и вознаграждения, а прибыльсрабатывает.
Выход из короткой позиции:
- Если цена поднимается выше самой высокой скользящей среднейв момент входа, стоп-лосссрабатывает.
- Если цена падает на большее расстояние, чем разница между ценой входа и самым высоким MA × коэффициентом риска-доходности, a Тейк-профитсрабатывает.
Пример диаграммы
- Торговый сигнал триггер
На графике ниже показан самый последний сигнал входа, сработавший стратегией 8 мая 2025 года, используя 2-часовой свечной график ETH/USDT. Как видно, цена резко выросла после того, как шесть скользящих средних сблизились, соответствуя установленным условиям входа стратегии. Система выполнена купить ордер в момент прорыва, успешно захватив начальную точку последующего восстания.
Рисунок 8: Иллюстрация точки входа на основе стратегических условий для ETH/USDT на 8 мая 2025 года
- Исполнение сделки и результат
Система автоматически закрыла позицию по достижении установленного соотношения риска и вознаграждения в соответствии с динамическим механизмом фиксации прибыли, блокируя основную часть ценового колебания. Хотя после этого был дополнительный рост, сделка строго следовала правилам стратегии, демонстрируя надежный контроль над рисками и последовательность исполнения. В будущем внедрение трейлинг-стопа или механизма последования тренду может потенциально увеличить прибыль во время сильных фаз импульса.
Рисунок 9: Иллюстрация точки выхода из стратегии для ETH/USDT на 8 мая 2025 года
Через приведенный выше живой пример мы четко продемонстрировали логику входа в стратегию и динамический механизм взятия профита, срабатываемый условиями схождения скользящего среднего и прорыва цены. Используя взаимодействие между ценой и структурой скользящего среднего, стратегия точно захватывает точку начала тренда и автоматически выходит во время последующих колебаний, обеспечивая основные сегменты прибыли при эффективном контроле риска.
Этот случай не только подтверждаетПрактичность и дисциплина исполнениястратегии, но также подчеркивает ееустойчивость и способность управлять рискамив реальных рыночных условиях, заложив прочный фундамент для будущей оптимизации параметров и стратегического совершенствования.
4. Практический пример обратного тестирования
Настройка параметров обратного тестирования
Для определения оптимальных комбинаций параметров мы провели систематический поиск по сетке в следующих диапазонах:
tp_sl_ratio: от 3 до 14 (с шагом 1)порог: 1 до 19.9 (увеличение на 0.1)
Используя ETH/USDTв качестве примера система прошла тестирование23,826 комбинаций параметровна 2-часовых свечах за последний год. Из них были выбраны пять лучших наборов на основе накопленной доходности. Метрики оценки включалигодовая доходность, коэффициент Шарпа, максимальное падение, и ROMAD(Return Over Maximum Drawdown), обеспечивая всестороннюю оценку производительности стратегии.
Рисунок 10: Сравнение производительности лучших пяти наборов параметров стратегии
Объяснение логики стратегии
Стратегия срабатывает сигналом на покупку, когда система обнаруживает, что расстояние между шестью скользящими средними сходится в пределах1.4%, и цена прорывается вверх через верхнюю границу скользящих средних. Эта структура направлена на захват момента начала прорыва, входя в позицию по текущей цене и используя наивысшее скользящее среднее на момент прорыва в качестве опорной точки для динамического фиксации прибыли, улучшая управление вознаграждением.
Стратегия использует следующие настройки:
процентный порог= 1.4 (максимально допустимое расстояние между шестью скользящими средними)tp_sl_ratio= 10 (динамический коэффициент профита)короткий период= 6,долгий период= 14 (периоды наблюдения скользящей средней)
Анализ производительности и результатов
Период обратного тестирования охватывает 1 мая 2024 года по 12 мая 2025 года. В течение этого временного интервала выбранный набор параметров принес выдающиеся результаты, с годовая доходность 127.59%, максимальное падение ниже 15%и кROMAD на 8.61%. Эти цифры демонстрируют сильный потенциал капиталовложений стратегии вместе с эффективным контролем риска на спад.
Как показано на графике, стратегия значительно превзошла Подход "Купи и удерживай" для ETHза последний год (который вернул-46.05%Его производительность была особенно заметной в периоды повышенной волатильности или разворотов тренда благодаря его надежным механизмам взятия прибыли и повторного входа. Контроль просадки был явно превосходным по сравнению с пассивным удержанием.
Мы также провели кросс-сравнение топ пять наборов параметровс текущей конфигурацией достигается лучший баланс междуОтдача и стабильность, что делает его чрезвычайно практичным для применения в реальном мире. В будущем стратегия может быть дополнительно усовершенствована путем интеграции динамическая настройка порога, или включая фильтры объема и волатильности, для улучшения адаптивности на боковых рынках и возможности развертывания по всемунесколько активов и временных интервалов.
Рисунок 11: Сравнение накопленной доходности за год топ-5 стратегий по параметрам по сравнению с ETH Buy and Hold
5. Сводка стратегии
Стратегия «Breakout Moving Average Breakout Strategy» является стратегией динамической сходимости нескольких коротких и среднесрочных скользящих средних, ориентированной на трендовую динамику. Путем обнаружения сжатия скользящих средних и соответствующих прорывов цен стратегия нацелена на захват ключевых точек перегиба прямо перед началом движения рынка. Она интегрирует структурный анализ цен с динамическим механизмом фиксации прибыли для эффективного участия в коротких и среднесрочных колебаниях тренда при контроле риска на спад.
В этом обратном тестировании мы использовали ETH/USDT с данными свечей за 2 часа и провели систематический поиск по сетке из 23 826 комбинаций параметров. Период тестирования охватывал 1 мая 2024 года по 12 мая 2025 года, из которого были выбраны пять лучших наборов параметров на основе показателей доходности и контроля риска. Оценка производительности была основана на годовой доходности, максимальной просадке, коэффициенте Шарпа и ROMAD. Лучшая комбинация параметров: процентный порог = 1.4 и tp_sl_ratio = 10.
Достижение годовой доходности 127.59%, максимальное падение менее 15%, и ROMAD 8.61%, значительно превосходящее эталон ETH Buy and Hold за тот же период (который составил -46.05%).
Из анализа распределения параметров лучшие стратегии сосредоточены в регионах с низкойпорогзначения и умеренно-высокие tp_sl_ratio. Это говорит о том, что раннее обнаружение тесно сгруппированных скользящих средних, совмещенное с умеренно расслабленной настройкой профита, помогает захватить полные волн тренда. В отличие от этого, слишком высокие пороговые значения или слишком тесные цели профита часто приводили к частым входам и преждевременным выходам, что размывало общую производительность.
В общем, эта стратегия демонстрирует высокую эффективность возврата и сильный контроль над рисками в рамках среднесрочной ценовой структуры ETH. Логика устойчива и гибка при изменении параметров, что обеспечивает значительную применимость в реальном мире. Зоны параметров спорогмежду 1.3 и 1.5 иtp_sl_ratio Between 9 and 11 неизменно демонстрировал более высокие показатели по ключевым показателям, что отражает способность стратегии улавливать ранний импульс тренда и поддерживать прибыльные колебания. Кроме того, интеграция фильтров объема и механизмов исключения из ассортимента может повысить его адаптивность и устойчивость к различным рыночным условиям, расширяя его потенциал для развертывания на нескольких рынках.
Заключение
С 25 апреля по 12 мая криптовалютный рынок продемонстрировал структурный шаблон сильного движения цен в условиях осторожного настроения. BTC и ETH росли параллельно, при этом ETH показывал более значительный прирост и большую волатильность. Однако долгие и короткие соотношения и ставки финансирования не показывали явного бычьего уклона, указывая на ограниченный энтузиазм для преследования восходящего тренда. Общий интерес продолжал расти, с короткими позициями, ликвидированными массово в начале мая, за которыми последовали принудительные ликвидации длинных позиций 12 мая, подчеркивающие усиленное расхождение рынка в условиях высокого плеча. В целом, хотя цены укреплялись, рыночное настроение и капитальный импульс оставались несогласованными, что делает стратегию управления рисками и выбор момента критически важными для успешного исполнения.
Для количественного анализа была использована стратегия "Плотное прорывное среднее движение" с системной оптимизацией параметров и оценкой производительности с использованием данных 2-часовых ETH/USDT. Стратегия показала внушительную годовую доходность в размере 127,59%, значительно превосходя -46,05% доходность стратегии Покупки и Удержания ETH за тот же период. Благодаря использованию структур импульсов и фильтрации трендов стратегия продемонстрировала сильные возможности последования трендам и эффективный контроль за просадками.
Однако в живой торговле стратегия все еще может быть подвержена влиянию нестабильных рынков, экстремальной волатильности или сбоям сигналов. Рекомендуется комбинировать эту стратегию с дополнительными количественными факторами и надежными механизмами управления рисками для повышения стабильности и адаптивности, обеспечивая рациональное суждение и осторожность в исполнении.
Reference:
- Gate.io, https://www.gate.io/trade/BTC_USDT
- Gate.io, https://www.gate.io/trade/ETH_USDT
- Coinglass, https://www.coinglass.com/LongShortRatio
- Coinglass, https://www.coinglass.com/BitcoinOpenInterest?utm_source=chatgpt.com
- Gate.io, https://www.gate.io/futures_market_info/BTC_USD/capital_rate_history
- Gate.io, https://www.gate.io/futures/introduction/funding-rate-history?from=USDT-M&contract=ETH_USDT
- Coinglass, https://www.coinglass.com/pro/futures/Liquidations
- Glassnode, https://studio.glassnode.com/charts/ba1ec93d-85f4-41fe-5606-798a2f30013a?s=1679144783&u=1742303183
Достигнуть Gateэто всесторонняя платформа исследований блокчейна и криптовалют, предоставляющая читателям глубокий контент, включая технический анализ, актуальные идеи, обзоры рынка, исследования отрасли, прогнозы тенденций и анализ макроэкономической политики.
Отказ от ответственности
Инвестирование на рынке криптовалют связано с высоким риском. Пользователям рекомендуется провести независимое исследование и полностью понять характер активов и продуктов перед принятием любых инвестиционных решений.Gate.ioGate.io не несет ответственности за любые убытки или ущерб, возникшие в результате таких инвестиционных решений.
Пригласить больше голосов
Статьи по теме

Как лучше читать графики криптовалют

Исследование Gate: биткойн возвращается после преодоления отметки в $70 000, транзакции в блокчейне Solana опережают Ethereum

Исследование Gate: Обзор рынка криптовалют на 2024 год и прогноз трендов на 2025 год

Как использовать API для начала квантовой торговли

Исследование Gate: BTC превышает рубеж в 100 000 долларов, объем торгов криптовалютой в ноябре впервые превышает отметку в 10 триллионов долларов

Исследование Gate: отчет о финансировании отрасли Web3 - ноябрь 2024
ETH Сильно отскакивает, стратегия прорыва плотного скользящего среднего достигает 127% годового дохода|Исследование Gate
Предисловие
Сводка
Обзор рынка
Количественный анализ – стратегия прорыва плотного скользящего среднего
Заключение
Предисловие
В этом двухнедельном квантовом отчете (с 25 апреля по 12 мая) анализируются рыночные тенденции биткойна и Эфириума, используя ключевые индикаторы, такие как соотношение длинных и коротких позиций, открытый интерес и процентные ставки. В отчете исследуется применение стратегии «Прорыв средней скользящей» на рынке ETH/USDT, подробно описывается ее логическая структура и механизм идентификации сигналов. Через систематическую оптимизацию параметров и обратное тестирование стратегия демонстрирует надежные показатели в распознавании тенденций и контроле рисков, с ясной дисциплиной исполнения. В целом, она превосходит простой подход к покупке и удержанию ETH, предлагая практическую основу для квантовой торговли.
Сводка
- За последние две недели как BTC, так и ETH выросли, причем ETH показал больший прирост и проявил большую волатильность.
- Долгосрочное соотношение длинных и коротких позиций ETH значительно колебалось, что указывает на сильную краткосрочную торговую активность и рыночную спекуляцию во время ралли, при этом короткие позиции не проявляли явного отступления.
- Открытый интерес к BTC увеличился медленнее, в то время как ETH испытал более сильный взлет в начале мая.
- В целом рынок деривативов пережил волну ликвидации коротких позиций в начале мая, за которой последовала ликвидация длинных позиций 12 мая, подчеркивающая усиливающееся расхождение рынка под высоким плечом.
- Для квантитативного анализа была использована стратегия "Dense Moving Average Breakout Strategy", которая при оптимальных параметрах показала доходность до 127%.
Обзор рынка
1. Анализ волатильности цен биткойна и эфира
С середины апреля как BTC, так и ETH показали стабильную восходящую тенденцию, поддерживая относительно синхронный темп до начала мая. За этот период BTC вырос с примерно 78 000 USDT до почти 105 000 USDT, в то время как ETH вырос с приблизительно 1 600 USDT до примерно 2 600 USDT. Увеличение ETH было заметно больше, чем у BTC, что демонстрирует большую ценовую эластичность. В начале мая оба актива испытали резкий скачок, вероятно, вызванный смягчением тарифной политики, и BTC вошел в фазу отдачи.
BTC, с более высокой ценой и более низкой волатильностью, продемонстрировал более стабильную траекторию; в то время как ETH показал более сильный и быстрый рост. Изначально на рынке отсутствовали бычьи ожидания по отношению к ETH, что заставило его отстать. Однако по мере приближения мая — с предстоящим обновлением Pectra и снятием тарифов — ETH привлек внимание и пережил всплеск торгового объема, догоняя в производительности. Это расхождение указывает на обновленное краткосрочное внимание к ценности аллокации ETH на рынке.
Рисунок 1: BTC поднялся почти до 105 000 USDT, в то время как ETH стремился к отметке в 2 600 USDT — показывая более агрессивный рост и быструю реакцию цены.
С точки зрения волатильности как BTC, так и ETH испытали значительные изменения в паттернах колебаний с начала апреля по середину мая. В середине апреля волатильность BTC часто возрастала, отражая повышенное рыночное настроение и резкие корректировки цен. Однако к концу апреля и началу мая волатильность начала снижаться, что указывает на краткий период стабилизации рынка.
В отличие от этого, волатильность ETH испытала несколько резких взлетов, особенно вокруг прорыва цены, иногда даже превышая BTC. Это указывает на то, что ETH испытала более интенсивные краткосрочные колебания во время своего восходящего движения. В целом волатильность BTC была более равномерно распределена, в то время как волатильность ETH сосредоточилась в нескольких критических моментах, особенно вокруг ключевых прорывов цен, что свидетельствует о том, что ETH более подвержен моментальным капиталовложениям.
Рисунок 2: BTC проявлял относительно стабильную волатильность, в то время как ETH испытывал несколько резких всплесков волатильности.
В целом ETH продемонстрировал более крупный прирост цен и более концентрированные скачки волатильности во время этого рыночного цикла, что указывает на более сильную ценовую реакцию в ключевые моменты. В отличие от этого, BTC показал более стабильную восходящую тенденцию с более равномерно распределенным профилем волатильности, отражая его относительную устойчивость в условиях рыночных флуктуаций.
Хотя оба актива испытали синхронный взлет цен, их паттерны волатильности и ритмы разошлись значительно, подчеркивая отличительные рыночные характеристики и структурную динамику.
С точки зрения краткосрочной торговли контроль за притоками капитала в BTC и изменениями волатильности может служить ключевым индикатором общего аппетита к риску на рынке.
2. Анализ коэффициента длинной краткой позиции (LSR) для биткоина и эфира
Длинно-короткое соотношение (LSR) - ключевой показатель для измерения относительного объема агрессивных длинных и коротких позиций на рынке. Обычно используется для оценки рыночного настроения и силы доминирующих тенденций. LSR больше 1 указывает на то, что агрессивные ордера на покупку (длинные) превышают агрессивные ордера на продажу (короткие), что свидетельствует о бычьем настроении рынка.
По данным Coinglass, как BTC, так и ETH показали четкую восходящую тенденцию цен за последние две недели. Однако их LSR-шаблоны показывают различную степень расхождения. Для BTC LSR показал небольшой рост на ранней стадии ралли, но оставался колеблющимся вокруг 1, даже опускаясь ниже 1 примерно 10 мая. Это говорит о том, что несмотря на рост цен, короткие позиции также увеличились, что подразумевает, что некоторые инвесторы решили застраховаться или открыть короткие позиции на более высоких уровнях. На рынке не сформировалась четкая односторонняя бычья структура, и остается некоторое сомнение в устойчивости ралли.
В отличие от этого, LSR ETH проявил больше волатильности. Во время резкого роста с $2,000 до $2,600 коэффициент не поднимался стабильно, а вместо этого испытывал несколько резких колебаний, включая заметное падение около 10 мая. Это свидетельствует о том, что взлет цены ETH сопровождался интенсивной краткосрочной торговлей и рыночной борьбой, сохранившимся короткими позициями. Рыночное настроение оставалось разделенным на протяжении всего ралли.
Хотя BTC и ETH оба показали значительный рост цен за последние две недели, их LSR не показал устойчивого увеличения. Напротив, данные отражают широкую осторожность и хеджирование на более высоких уровнях цен, что свидетельствует о том, что бычий импульс не имеет четкой структурной поддержки, и инвестиционный сентимент остается осторожным.
Рисунок 3: Снижение BTC LSR в условиях волатильности, указывающее на ослабление бычьего импульса на более высоких уровнях
Рисунок 4: ETH LSR показывает высокую волатильность, отражающую значительное расхождение рыночного настроения
3. Анализ открытого интереса
Согласно данным от Coinglass, открытый интерес как у BTC, так и у ETH показал общий восходящий тренд, что указывает на рост участия рынка и торговой активности. Открытый интерес BTC стабильно рос с уровня около $60 миллиардов, испытывая некоторые флуктуации, но в основном удерживаясь на повышенных уровнях, в конечном итоге стабилизировавшись в начале мая. Открытый интерес ETH вырос с приблизительно $18 миллиардов до почти $24 миллиардов, следуя аналогичной траектории BTC, но с более стабильным движением. Следует отметить, что ETH заметно увеличил открытый интерес в начале мая, сигнализируя о возобновлении притока капитала и активном позиционировании во время этого периода.[4]
В целом одновременный рост открытого интереса и цен на оба актива подтверждает увеличение участия рынка и большее использование плеча. Однако, в то время как притоки BTC выровнялись после конца апреля, ETH продемонстрировал более сильный восходящий импульс в начале мая, что говорит о всплеске интереса к деривативной торговле ETH в краткосрочной перспективе.
Фигура 5: открытый интерес к BTC показывает более медленный восходящий импульс, в то время как ETH видит более сильный взлет в начале мая
4. Ставка финансирования
Ставки финансирования для BTC и ETH в целом незначительно колебались вокруг 0%, часто переключаясь между положительными и отрицательными, что указывает на относительно сбалансированную борьбу между длинными и короткими позициями. В конце апреля BTC несколько раз испытал отрицательные ставки финансирования, с заметным падением до -0,025% около 20 апреля, что может свидетельствовать о доминировании коротких позиций в то время - возможно из-за крупномасштабной хеджирования. ETH показало схожий паттерн в это время, хотя с немного меньшими колебаниями, указывающими на временный сдвиг к медвежьему настроению без устойчивого давления.
По мере роста цен и увеличения открытого интереса ставки по финансированию как для BTC, так и для ETH постепенно стали положительными, стабилизируясь между 0% и 0.01%. Это отражает растущий бычий настрой и активное долгосрочное позиционирование. Однако тот факт, что ставки по финансированию не резко увеличились, свидетельствует о том, что хотя плечо на длинных позициях увеличилось, рынок не перегрет, и настроение остается осторожно оптимистичным.
Рисунок 6: Ставки финансирования BTC и ETH постепенно становятся положительными и остаются в пределах от 0% до 0.01%, отражая растущую бычью тенденцию и активную длинную позицию
5. График ликвидации криптовалюты
Согласно данным Coinglass, с середины апреля криптовалютный рынок переживал чередующиеся волны ликвидации длинных и коротких позиций, при этом короткая ликвидация особенно активизировалась в начале мая. 8 мая короткая ликвидация значительно выросла, достигнув 836 миллионов долларов за один день, что указывает на резкий рост цен, вынуждая ликвидировать многие короткие позиции.
12 мая, по мере увеличения волатильности рынка, заметно выросли распродажи длинных позиций, с общим дневным объемом в $476 млн, что свидетельствует о том, что некоторые трейдеры, вошедшие в длинные позиции на более высоких уровнях, не смогли выдержать откат и были принудительно ликвидированы. Это указывает на то, что несмотря на общий бычий тренд, краткосрочная волатильность остается высокой, и как длинные, так и короткие позиции страдают на ключевых точках перегиба. Деривативный рынок остается очень активным и сосредоточенным на риске.
Этот шаблон соответствует ранее сделанным наблюдениям о росте цен, увеличении открытого интереса и изменении ставок финансирования на положительные, что подчеркивает, как шорты были вымыты во время крупных прорывов цен, давая быкам временное преимущество. Однако даже во восходящем тренде длинные позиции все равно могут столкнуться с ликвидацией на местных максимумах, особенно во время периодов усиленной волатильности, таких как середина мая. Это подчеркивает устойчивую волатильность на рынке, где высокий уровень кредитного плеча и активное риск-хеджирование остаются определяющими чертами торговли криптодеривативами.
Рисунок 7: Краткосрочные ликвидации взлетели 8 мая, достигнув $836 миллионов за один день
Количественный анализ – стратегия прорыва плотного скользящего среднего
(Предупреждение: Все прогнозы в этой статье основаны на исторических данных и рыночных тенденциях и предназначены исключительно в информационных целях. Их нельзя считать инвестиционными советами или гарантией будущей рыночной производительности. Инвесторам следует тщательно оценить риски и принимать благоразумные решения при осуществлении связанных инвестиций.)
1. Обзор стратегии
Стратегия "Плотное прорывное среднее движение" - это подход на основе импульса, который включает в себя технический анализ тренда. Стратегия идентифицирует потенциальные направленные рыночные движения, наблюдая за сближением нескольких коротких и средних скользящих средних (например, 5-дневных, 10-дневных, 20-дневных) за определенный период. Когда эти скользящие средние начинают выравниваться и кластеризоваться близко, это typично сигнализирует о фазе консолидации, указывая на то, что рынок готовится к прорыву.
Если цена решительно преодолевает кластерные скользящие средние, это интерпретируется как сигнал бычьего прорыва. Напротив, прорыв ниже полосы скользящей средней указывает на медвежий сигнал.
Для повышения практичности и улучшения управления рисками стратегия также включает механизмы фиксированного процентного уровня прибыли и стоп-лосс, позволяющие своевременно входить и выходить при появлении тенденций, балансируя вознаграждение и риск. В целом эта стратегия разработана для захвата возможностей коротких и среднесрочных тенденций, предлагая дисциплинированную и действенную торговую схему.
2. Настройки основных параметров
3. Логика стратегии и операционный механизм
Условия входа
Проверка схождения скользящих средних: Рассчитайте расстояние между максимальными и минимальными значениями шести скользящих средних — SMA20, SMA60, SMA120, EMA20, EMA60 и EMA120. Когда расстояние опускается ниже заданного порога (например, 1.5% от цены), это считается схождением скользящих средних.
«Порог» относится к критическому значению, при котором происходит срабатывание эффекта, либо как минимум, либо как максимум.Условия разрыва цены:
- Если текущая цена прорывается выше самой высокой из шести скользящих средних, это считается сигналом восходящего прорыва и запускает купитьоперация.
- Если текущая ценападает ниже самого низкого из шести скользящих средних, это считается сигналом разворота вниз и вызывает продатьоперация.
Условия выхода: динамический механизм фиксации прибыли и остановки убытков
Выход из длинной позиции:
- Если цена падает ниже самой низкой скользящей среднейв момент входа, стоп-лосс is triggered.
- Если цена рост на сумму, превышающую расстояние между ценой входа и самым низким MA × коэффициентом риска и вознаграждения, а прибыльсрабатывает.
Выход из короткой позиции:
- Если цена поднимается выше самой высокой скользящей среднейв момент входа, стоп-лосссрабатывает.
- Если цена падает на большее расстояние, чем разница между ценой входа и самым высоким MA × коэффициентом риска-доходности, a Тейк-профитсрабатывает.
Пример диаграммы
- Торговый сигнал триггер
На графике ниже показан самый последний сигнал входа, сработавший стратегией 8 мая 2025 года, используя 2-часовой свечной график ETH/USDT. Как видно, цена резко выросла после того, как шесть скользящих средних сблизились, соответствуя установленным условиям входа стратегии. Система выполнена купить ордер в момент прорыва, успешно захватив начальную точку последующего восстания.
Рисунок 8: Иллюстрация точки входа на основе стратегических условий для ETH/USDT на 8 мая 2025 года
- Исполнение сделки и результат
Система автоматически закрыла позицию по достижении установленного соотношения риска и вознаграждения в соответствии с динамическим механизмом фиксации прибыли, блокируя основную часть ценового колебания. Хотя после этого был дополнительный рост, сделка строго следовала правилам стратегии, демонстрируя надежный контроль над рисками и последовательность исполнения. В будущем внедрение трейлинг-стопа или механизма последования тренду может потенциально увеличить прибыль во время сильных фаз импульса.
Рисунок 9: Иллюстрация точки выхода из стратегии для ETH/USDT на 8 мая 2025 года
Через приведенный выше живой пример мы четко продемонстрировали логику входа в стратегию и динамический механизм взятия профита, срабатываемый условиями схождения скользящего среднего и прорыва цены. Используя взаимодействие между ценой и структурой скользящего среднего, стратегия точно захватывает точку начала тренда и автоматически выходит во время последующих колебаний, обеспечивая основные сегменты прибыли при эффективном контроле риска.
Этот случай не только подтверждаетПрактичность и дисциплина исполнениястратегии, но также подчеркивает ееустойчивость и способность управлять рискамив реальных рыночных условиях, заложив прочный фундамент для будущей оптимизации параметров и стратегического совершенствования.
4. Практический пример обратного тестирования
Настройка параметров обратного тестирования
Для определения оптимальных комбинаций параметров мы провели систематический поиск по сетке в следующих диапазонах:
tp_sl_ratio: от 3 до 14 (с шагом 1)порог: 1 до 19.9 (увеличение на 0.1)
Используя ETH/USDTв качестве примера система прошла тестирование23,826 комбинаций параметровна 2-часовых свечах за последний год. Из них были выбраны пять лучших наборов на основе накопленной доходности. Метрики оценки включалигодовая доходность, коэффициент Шарпа, максимальное падение, и ROMAD(Return Over Maximum Drawdown), обеспечивая всестороннюю оценку производительности стратегии.
Рисунок 10: Сравнение производительности лучших пяти наборов параметров стратегии
Объяснение логики стратегии
Стратегия срабатывает сигналом на покупку, когда система обнаруживает, что расстояние между шестью скользящими средними сходится в пределах1.4%, и цена прорывается вверх через верхнюю границу скользящих средних. Эта структура направлена на захват момента начала прорыва, входя в позицию по текущей цене и используя наивысшее скользящее среднее на момент прорыва в качестве опорной точки для динамического фиксации прибыли, улучшая управление вознаграждением.
Стратегия использует следующие настройки:
процентный порог= 1.4 (максимально допустимое расстояние между шестью скользящими средними)tp_sl_ratio= 10 (динамический коэффициент профита)короткий период= 6,долгий период= 14 (периоды наблюдения скользящей средней)
Анализ производительности и результатов
Период обратного тестирования охватывает 1 мая 2024 года по 12 мая 2025 года. В течение этого временного интервала выбранный набор параметров принес выдающиеся результаты, с годовая доходность 127.59%, максимальное падение ниже 15%и кROMAD на 8.61%. Эти цифры демонстрируют сильный потенциал капиталовложений стратегии вместе с эффективным контролем риска на спад.
Как показано на графике, стратегия значительно превзошла Подход "Купи и удерживай" для ETHза последний год (который вернул-46.05%Его производительность была особенно заметной в периоды повышенной волатильности или разворотов тренда благодаря его надежным механизмам взятия прибыли и повторного входа. Контроль просадки был явно превосходным по сравнению с пассивным удержанием.
Мы также провели кросс-сравнение топ пять наборов параметровс текущей конфигурацией достигается лучший баланс междуОтдача и стабильность, что делает его чрезвычайно практичным для применения в реальном мире. В будущем стратегия может быть дополнительно усовершенствована путем интеграции динамическая настройка порога, или включая фильтры объема и волатильности, для улучшения адаптивности на боковых рынках и возможности развертывания по всемунесколько активов и временных интервалов.
Рисунок 11: Сравнение накопленной доходности за год топ-5 стратегий по параметрам по сравнению с ETH Buy and Hold
5. Сводка стратегии
Стратегия «Breakout Moving Average Breakout Strategy» является стратегией динамической сходимости нескольких коротких и среднесрочных скользящих средних, ориентированной на трендовую динамику. Путем обнаружения сжатия скользящих средних и соответствующих прорывов цен стратегия нацелена на захват ключевых точек перегиба прямо перед началом движения рынка. Она интегрирует структурный анализ цен с динамическим механизмом фиксации прибыли для эффективного участия в коротких и среднесрочных колебаниях тренда при контроле риска на спад.
В этом обратном тестировании мы использовали ETH/USDT с данными свечей за 2 часа и провели систематический поиск по сетке из 23 826 комбинаций параметров. Период тестирования охватывал 1 мая 2024 года по 12 мая 2025 года, из которого были выбраны пять лучших наборов параметров на основе показателей доходности и контроля риска. Оценка производительности была основана на годовой доходности, максимальной просадке, коэффициенте Шарпа и ROMAD. Лучшая комбинация параметров: процентный порог = 1.4 и tp_sl_ratio = 10.
Достижение годовой доходности 127.59%, максимальное падение менее 15%, и ROMAD 8.61%, значительно превосходящее эталон ETH Buy and Hold за тот же период (который составил -46.05%).
Из анализа распределения параметров лучшие стратегии сосредоточены в регионах с низкойпорогзначения и умеренно-высокие tp_sl_ratio. Это говорит о том, что раннее обнаружение тесно сгруппированных скользящих средних, совмещенное с умеренно расслабленной настройкой профита, помогает захватить полные волн тренда. В отличие от этого, слишком высокие пороговые значения или слишком тесные цели профита часто приводили к частым входам и преждевременным выходам, что размывало общую производительность.
В общем, эта стратегия демонстрирует высокую эффективность возврата и сильный контроль над рисками в рамках среднесрочной ценовой структуры ETH. Логика устойчива и гибка при изменении параметров, что обеспечивает значительную применимость в реальном мире. Зоны параметров спорогмежду 1.3 и 1.5 иtp_sl_ratio Between 9 and 11 неизменно демонстрировал более высокие показатели по ключевым показателям, что отражает способность стратегии улавливать ранний импульс тренда и поддерживать прибыльные колебания. Кроме того, интеграция фильтров объема и механизмов исключения из ассортимента может повысить его адаптивность и устойчивость к различным рыночным условиям, расширяя его потенциал для развертывания на нескольких рынках.
Заключение
С 25 апреля по 12 мая криптовалютный рынок продемонстрировал структурный шаблон сильного движения цен в условиях осторожного настроения. BTC и ETH росли параллельно, при этом ETH показывал более значительный прирост и большую волатильность. Однако долгие и короткие соотношения и ставки финансирования не показывали явного бычьего уклона, указывая на ограниченный энтузиазм для преследования восходящего тренда. Общий интерес продолжал расти, с короткими позициями, ликвидированными массово в начале мая, за которыми последовали принудительные ликвидации длинных позиций 12 мая, подчеркивающие усиленное расхождение рынка в условиях высокого плеча. В целом, хотя цены укреплялись, рыночное настроение и капитальный импульс оставались несогласованными, что делает стратегию управления рисками и выбор момента критически важными для успешного исполнения.
Для количественного анализа была использована стратегия "Плотное прорывное среднее движение" с системной оптимизацией параметров и оценкой производительности с использованием данных 2-часовых ETH/USDT. Стратегия показала внушительную годовую доходность в размере 127,59%, значительно превосходя -46,05% доходность стратегии Покупки и Удержания ETH за тот же период. Благодаря использованию структур импульсов и фильтрации трендов стратегия продемонстрировала сильные возможности последования трендам и эффективный контроль за просадками.
Однако в живой торговле стратегия все еще может быть подвержена влиянию нестабильных рынков, экстремальной волатильности или сбоям сигналов. Рекомендуется комбинировать эту стратегию с дополнительными количественными факторами и надежными механизмами управления рисками для повышения стабильности и адаптивности, обеспечивая рациональное суждение и осторожность в исполнении.
Reference:
- Gate.io, https://www.gate.io/trade/BTC_USDT
- Gate.io, https://www.gate.io/trade/ETH_USDT
- Coinglass, https://www.coinglass.com/LongShortRatio
- Coinglass, https://www.coinglass.com/BitcoinOpenInterest?utm_source=chatgpt.com
- Gate.io, https://www.gate.io/futures_market_info/BTC_USD/capital_rate_history
- Gate.io, https://www.gate.io/futures/introduction/funding-rate-history?from=USDT-M&contract=ETH_USDT
- Coinglass, https://www.coinglass.com/pro/futures/Liquidations
- Glassnode, https://studio.glassnode.com/charts/ba1ec93d-85f4-41fe-5606-798a2f30013a?s=1679144783&u=1742303183
Достигнуть Gateэто всесторонняя платформа исследований блокчейна и криптовалют, предоставляющая читателям глубокий контент, включая технический анализ, актуальные идеи, обзоры рынка, исследования отрасли, прогнозы тенденций и анализ макроэкономической политики.
Отказ от ответственности
Инвестирование на рынке криптовалют связано с высоким риском. Пользователям рекомендуется провести независимое исследование и полностью понять характер активов и продуктов перед принятием любых инвестиционных решений.Gate.ioGate.io не несет ответственности за любые убытки или ущерб, возникшие в результате таких инвестиционных решений.
Статьи по теме
Как лучше читать графики криптовалют
Исследование Gate: биткойн возвращается после преодоления отметки в $70 000, транзакции в блокчейне Solana опережают Ethereum
Исследование Gate: Обзор рынка криптовалют на 2024 год и прогноз трендов на 2025 год
Как использовать API для начала квантовой торговли
Исследование Gate: BTC превышает рубеж в 100 000 долларов, объем торгов криптовалютой в ноябре впервые превышает отметку в 10 триллионов долларов